Off the ticker — Nepal and Tibetティッカーに載らないネパールと中国の話
What the ground recorded
At 8:37 in the morning on 26 August, a piece of a mountain in northern Nepal let go. Seismometers around the world wrote it down before any reporter had heard of it, and the machines disagreed politely about what they had just seen. Twelve days on, the instruments have told us a great deal about how it moved. What set it loose is still an open question, and that question is the reason to read on.
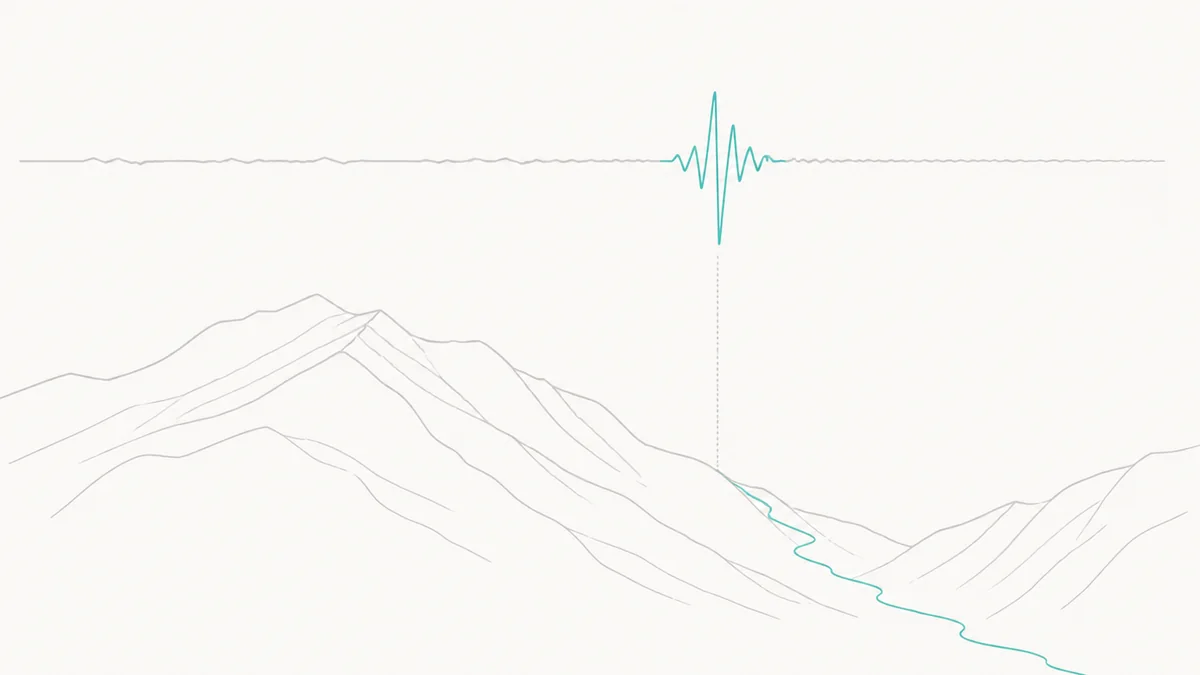
Most coverage of a disaster of this size is organised around a number that goes up. This piece is organised the other way round, because the more useful record is the one the earth keeps of itself, and because the people who read that record are unusually good at saying what they do not know. There is a paragraph of casualty figures further down, with the date and the agency attached to every one of them, and it is one paragraph rather than a headline.
The instruments
The United States Geological Survey catalogue holds the event as us7000tbwb. Origin time 02:52:10 UTC on 26 August 2026, which is 8:37 in the morning in Nepal. Surface‑wave magnitude 5.2. Depth: zero. Location: 28.271°N, 85.515°E, in Langtang National Park, near the Chinese border. And in the field where that catalogue normally says earthquake, it says landslide.
That word is the whole story of the first twenty‑four hours. On the morning itself nobody knew what had happened. Rasuwa’s chief district officer, Narendra Pariyar, told the Nepali daily Kantipur that day: “There has been no rain here. The sun is out. We don’t know whether a glacial lake burst upstream or what happened. The flood appeared suddenly.” The instruments had recorded a tremor, and a tremor invites an obvious and wrong conclusion. “Our records showed a 4.4 magnitude,” Lok Vijay Adhikari, who runs Nepal’s National Earthquake Monitoring and Research Center, told The Kathmandu Post. “But the frequency of the seismic activity did not match that of an earthquake, which is the department’s monitoring mandate, so we did not alert the public like we usually do.” The USGS reached the same conclusion from long‑period waves and reclassified the event. Nothing shook the mountain loose. The mountain coming loose was the shaking.
Three hours and eight minutes later, at 06:00:35 UTC, the same catalogue records a second landslide at effectively the same coordinates, surface‑wave magnitude 4.2. Whatever failed on that face was not finished.
In Potsdam, the GFZ Helmholtz Centre for Geosciences logged the first event independently as Nepal–China Border Region (Landslide), moment magnitude 5.7, manually revised, at 02:52:23.1 UTC. Its surface waves reached a seismic station in Saxony‑Anhalt about forty minutes later. Two agencies, two magnitude scales, two answers — 5.2 and 5.7 — which is normal and worth saying plainly, because a single confident number is usually a number somebody has rounded for you. GFZ’s own summary gives the range: “The magnitude was estimated at 5.2 to 5.7 Mw.”
Everything above is instrumental. It is the part of this story that is not in dispute.
Seven minutes
Here is where the record stops being abstract. GFZ’s reconstruction: rock and ice slid down a steep slope, generating enough heat to melt a great volume of ice almost instantly; that meltwater picked up boulders, rubble and streambed sediment and became a mudflow moving down the Lhende Khola. “The wall of water reached heights of several tens of metres and a velocity between 40 to 50 metres per second, i.e., more than 130 kph.”
China’s Ministry of Natural Resources arrived at the same speed by a completely different route. Working from three‑dimensional before‑and‑after imagery, Guo Zhaocheng of the China Aero Geophysical Survey and Remote Sensing Centre put the source at about 5,140 metres above sea level and Gyirong Port at about 1,800 — a drop of nearly 3,300 metres over roughly twenty kilometres. The collapse began around 10:52 Beijing time; camera footage shows the flow arriving at the border post around 10:59. Twenty kilometres in about seven minutes. An average of roughly 50 metres per second.
Two agencies who were not checking each other’s work landed on the same figure.
Two things from that analysis stay with me. The first is GFZ’s note that surveillance camera timestamps at the border read 10:59 in the morning, and that “all infrastructure at the border was obliterated and a massive debris fill now occupies the site.” The second is stranger and purely physical: when the flow hit the main river channel at Gyirong, part of it turned and ran upstream, against the current, for nearly three kilometres up the Gyirong Tsangpo. A river cannot do that. Only something with far more momentum than a river can do that.
Downstream, GFZ traced a zone of destruction extending more than 100 kilometres down the Trishuli valley, and a river‑level rise of more than 10 metres at the confluence with the Seti Gandaki. The USGS puts the travel distance at approximately 100 kilometres and marks its own page, correctly, as preliminary and subject to revision.
Nobody has agreed on what to call it
You will have read “glacier collapse” in almost every headline. The scientists are not there yet, and their hesitation is the most interesting thing in the file.
The USGS, on 28 August: “At this time, it is unclear if the initial slope failure was a landslide incorporating part of a glacier or a glacial collapse.” Stuart Dunning, professor of applied geomorphology at Newcastle University, who studied the closely comparable 2021 Chamoli disaster in India, laid out three possibilities and refused to choose between them: a bedrock landslide that took the glacier with it; a bedrock landslide that destabilised the glacier so that it fell shortly after; or the glacier failing first and the rock above following. His preferred description is deliberately agnostic about order: “a rock‑ice avalanche began at around 4,800 metres and fell over 1,200 metres.”
By 1 September, the glaciologist Levan Tielidze and Tirthankar Ghosh were writing that satellite and photographic evidence pointed to “an avalanche of rock and ice, rather than a simple glacier collapse,” and that the rock probably went first: “It’s likely that the steep slope of bedrock collapsed first, followed by the overhang of ice.” Mylène Jacquemort of ETH Zurich, asked by Yale Climate Connections whether this belonged to the category of sudden detachments of low‑angle glaciers described in a 2021 paper she co‑authored, replied: “Definitely no! It was a large rock avalanche with a glacier on top.”
Notice that the starting elevation moves depending on who is answering: about 4,800 metres from Dunning, about 5,140 from the Chinese survey. Both are working from real measurements. Twelve days is not long enough for those to converge, and a piece that hid the discrepancy from you would be a worse piece.
One thing everyone agrees on, and it matters more than the label. Dunning: “It is easy to see why the first reports assumed it was a glacial lake outlet flood, or Glof, since that is perhaps the best known source of such cascades. However, in this case, there was no lake.” He is calling the whole thing a hazard cascade or a process chain — a sequence in which each step arms the next — and he says he is one of fifty or more specialists still arguing about the vocabulary. The ice, he adds, mostly vanished on the way down, melted by fragmentation and friction: “In other events we have found rounded bits of ice in the deposits that were transported along and then melted out much later.”
There was a blockage, though, even without a lake. The best current reconstruction, from Tielidze’s satellite work, is that the avalanche entered the Lhende Khola “where it either caused or contributed to a temporary blockage. When this burst, a catastrophic flash flood travelled almost 100 kilometres downstream.” A dam that existed for minutes, made of the mountain that had just fallen.
Could anything have seen it coming?
On 27 August, Dunning said flatly: “There are thousands of slopes of this kind in the region so it’s difficult to monitor and predict. So far, we have not any spotted obvious precursors.”
Six days later, someone had found one. Manoochehr Shirzaei, a geophysicist at Virginia Tech, went back through European Space Agency radar data from the Sentinel‑1 satellites covering 8 January to 18 August — the last pass came seven days before the collapse — and found the glacier–rock system creeping downhill at roughly 10 millimetres a month, and, more importantly, speeding up. Read his own caveats, because they are the point: “The acceleration alone would not have told us ‘collapse imminent, evacuate now’. Rather, had the signals been identified before the collapse, the area could have been flagged as a hotspot warranting closer attention and monitoring.” And: “These results are still preliminary.”
So the honest answer is not yes and not no. It is: there was a signal, nobody was looking at that particular slope, and even if they had been, the signal said watch this rather than run.
Thirty-eight minutes
Reconstruct the warning that did go out, minute by minute, and you can see exactly which piece of the system broke.
8:37 — the collapse. 8:50 — the flood reaches the hydrological station at Syabrubesi and destroys the river gauge. That gauge was built to notice rivers rising slowly; it was not built to survive what was coming and it did not report it. 9:00 — the district administrative officer in Rasuwa reaches the Department of Hydrology and Meteorology by telephone. By then communications towers are gone and people are warning each other door to door. 9:15 — text alerts go out across Rasuwa, Nuwakot, Dhading and Chitwan, telling people to move to higher ground. Thirty‑eight minutes after the mountain moved.
Anil Pokhrel, who used to run Nepal’s national disaster authority, put the structural problem in one sentence: “There is no such thing as an early warning system in Nepal. Simply having sensors does not mean it’s a system; it has to be much more comprehensive.”
GFZ’s critique is the same critique from the other end of the telescope, and it generalises well beyond Nepal. Flash‑flood warning today mostly means instrumenting individual glacial lakes with water‑level sensors. That approach requires you to have correctly guessed which lakes are dangerous, gets more expensive as the lakes multiply, and — the line to remember — “does not account for the important number of floods that don’t involve the purging of a pre‑existing glacier lake.” Then: “Almost all of the catastrophic events of recent years in the Himalaya have originated from sources not designated as dangerous.” And the sensors sit on riverbanks, “where they are easily destroyed during flood events” — which is precisely what happened at Syabrubesi at 8:50.
The alternative GFZ is building is the one this disaster argues for. Niels Hovius, who heads its geomorphology section and has worked in the region for over a decade: “There is no way to prevent such events. They are natural events, occurring several times per year in the Himalayas. However, early warning systems based on seismic signals are possible. Such a system could have issued warnings downstream with only a few minutes delay. This could give people minutes to tens of minutes to reach safe ground.”
This is not speculation. A 2021 paper in Science by Kristen L. Cook, Hovius and colleagues took the disaster of 7 February 2021 in Uttarakhand, India — the Chamoli event — and showed that the seismic network which already existed would have allowed up to eleven minutes of warning for the place where most of the deaths occurred, a hydropower site under construction, had anything been wired to detect and act on the signal in real time. Eleven minutes is not much. At Gyirong, the whole event took seven.
And there is a border running through the middle of the problem. Qianggong Zhang, who heads climate and environmental risks at the International Centre for Integrated Mountain Development, points out that because the avalanche started inside Nepali territory, it fell outside the reach of the Chinese early‑warning system. Shirzaei makes the same point from the satellite side: effective warning “depend[s] on the rapid sharing of observations and hazard information between countries.” A seismometer does not care where the line on the map is. Everything downstream of the seismometer does.
Was it the warming?
The careful answer is not the satisfying one, so here it is in the order the evidence supports.
First, the specific event. Saswata Sanyal, a disaster risk specialist at ICIMOD, has said that while climate change drives broader cryospheric risk across the Hindu Kush Himalaya, this particular disaster cannot yet be directly attributed to warming. Dunning agrees and adds the other ingredients: climate change “plays a role — perhaps an increasing one — alongside other preconditioning factors such as earthquake damage to rock, rapidly uplifting mountains that gravity wants to bring down.” He also declines the tempting conclusion: “extreme events are just that, extreme and rare, our knowledge back in time is not always strong enough to say with absolute certainty that we have crossed a threshold.”
Second, the mechanism, which is where warming genuinely enters. Permafrost — ground that has stayed below freezing for years — is, in Dunning’s phrase, sometimes described as the “glue” holding bedrock together. Thaw the glue and fractured rock that has held for centuries stops holding. Tielidze and Ghosh add the numbers: of sixty large rock–ice avalanches analysed across High Mountain Asia, 86% began on slopes steeper than 30 degrees and above 3,000 metres, and 65% began where permafrost was probable. ICIMOD’s director general, Pema Gyamtsho, who called this flood a “tsunami from the sky,” makes the regional point his organisation has been making for years: the Himalayas are warming at about twice the global average.
Third, the company this event keeps. In February 2021 at Chamoli in India, a landslide off Ronti Peak set an estimated 27 million cubic metres of rock and ice moving down a valley; more than 200 people were killed or never found. In 2015, the same Langtang massif produced a debris avalanche after the magnitude 7.8 earthquake — several million cubic metres of ice and debris from 5,000 metres, falling nearly 1,900, burying a village and killing more than 200. That one had an earthquake to blame. This one did not.
So: not climate change caused this, but something closer to this is the kind of event a warming, thawing mountain range produces more of, and there is a physical reason why. The difference between those two sentences is the difference between a claim that survives the next five years of research and one that does not.
Two other places where the ice let go
If the mechanism is real, it should show up elsewhere. It does, at both ends of the planet, and in one case it was measured by the same institute using the same technique.
On 16 September 2023, a mountainside fell into Dickson Fjord in eastern Greenland. The tsunami it raised left flood traces more than 200 metres up the rock near the entry point and averaged 60 metres along ten kilometres of coast. Seismometers 5,000 kilometres away registered the rockslide as a brief signal — and then registered something else: a very‑long‑period tone that went on for more than a week. GFZ’s team, led by Angela Carrillo Ponce, worked out that the tsunami had set up a standing wave sloshing back and forth in the narrow fjord, about a metre high, still ringing more than a week later. Nobody was hurt; the fjord is uninhabited. Their conclusion is the one that connects Greenland to Langtang: “It is obvious that the retreat of glaciers, which previously filled entire valleys, and the thawing of permafrost are leading to increased landslides.”
Antarctica’s version is slower and has nothing to do with falling rock, which is why it belongs here spelled out rather than waved at. Between January 2022 and March 2023, Hektoria Glacier on the Antarctic Peninsula shortened by about 25 kilometres. Inside that period was a two‑month stretch in which the terminus went back more than 8 kilometres — the fastest loss of grounded ice ever observed, according to NASA’s Earth Observatory summarising work published in Nature Geoscience. Grounded is the operative word: the glacier lost not only its floating tongue, which displaces no extra seawater, but ice that had been resting on bedrock, which raises sea level directly. The chain there runs back to 2002, when the Larsen B ice shelf that had been buttressing Hektoria collapsed.
Three very different places, three different mechanisms, and one thing in common underneath: ice that had been doing structural work for a long time stopped doing it. That is as far as the evidence goes.
The other side of the border
Gyirong Port took the flow first, seven minutes in, and it is the part of this disaster the world has seen the least of.
The official figures come from Xinhua, reporting a press conference held in Gyirong County on 6 September: forty‑three confirmed dead and 519 missing as of 6 p.m. on 5 September, with 261 of the missing being foreign nationals from 23 countries. More than 2,500 personnel and over 500 vehicles were deployed; drones flew more than a thousand sorties and air‑dropped 5.43 tonnes of supplies. Local authorities assisted 1,720 Nepali border residents stranded on the Chinese side when the crossing they normally use to go home ceased to exist. Xinhua notes that the press conference “was held after journalists from overseas media outlets visited the mudslide site at Gyirong Port over the weekend” — eleven days after the flood. Almost everything in this section comes from that one agency, which is a limit on what anyone outside can say about the Chinese side, including this article.
What China has published generously is the science. The three‑dimensional before‑and‑after imagery released by its Ministry of Natural Resources is the clearest public picture of the source area anywhere, and it is the basis for the speed calculation quoted above. Xinhua also says China has been giving Nepal daily meteorological, hydrological and glacier data through a disaster notification mechanism. On the ground, the recovery problem is the mirror image of Nepal’s: National Highway G216 is damaged, the rural roads down the Donglin Tsangpo valley below the port were washed out completely, and the gully is too narrow and too steep to give rescuers room to work.
The count, and what it will cost
Here is the paragraph. Every figure carries the date and the body that issued it, and every one of them will be out of date by the time you read this.
Nepal’s Ministry of Foreign Affairs, in its daily situation update timed at 14:00 Nepal time on 6 September 2026: 1,341 bodies recovered; around 5,000 people still missing, including approximately 600 foreign nationals from 35 countries; 13,104 people rescued so far, including more than 300 foreigners. Four people were pulled out alive in the three days to 6 September. The ministry adds its own caveat — “These figures are constantly updated as search and verification continue” — and that is the most important sentence in it. China’s figures are in the section above.
On money, a unit first, because the number is meaningless without one. Nepal’s currency is the rupee, and Nepal Rastra Bank’s published rate for 5 September 2026 was 150.88 rupees to the US dollar buying, 151.48 selling. At its briefing on Thursday 3 September, the National Disaster Risk Reduction and Management Authority gave a preliminary damage estimate of 387.54 billion rupees — about 2.6 billion US dollars at that rate — with the detailed assessment still to come. Its executive director, Dharma Raj Upreti, separately estimated that restoring services over the next four months would need 8 billion rupees, roughly 53 million dollars, covering “buildings, communications, energy and transport systems, health, nutrition, education, agriculture and livestock.”
Put those two numbers side by side and you have the shape of the next decade. The first is what was destroyed. The second is what it costs merely to keep the valley functioning while the first is dealt with. Twelve days in, the Nepali Army is building a temporary bridge over the Tadi river to reopen the Galchhi–Trishuli road, and two cable pulleys — tuen, in the ministry’s own word for them — have been made to work again at Trishuli Indrenighat and Devighat. That is where recovery actually starts: a wire across a river.
What that repair actually consists of, a fortnight in, is water. UNICEF said on 3 September that at least 22,000 children in the affected districts urgently needed safe drinking water, sanitation and hygiene support, with community and larger water schemes damaged across the districts and families crowded into host households and holding centres. It had dispatched supplies for around 19,000 people in Rasuwa and Nuwakot — more than 3,800 hygiene kits, 3,300 collapsible ten-litre jerrycans, 3,500 buckets, 4,000 bottles of water treatment solution. Alice Akunga, its representative in Nepal, put the timescale in a sentence that belongs at the end of any piece about a disaster: “Restoring communities’ access to safe water and sanitation is not a one-week job. We can provide water treatment products and emergency supplies today, and we are. But damaged water systems, pipelines, pumps, toilets and other sanitation infrastructure also need to be repaired and rebuilt. And they need to be rebuilt to withstand future floods, not simply restored to the way they were before.”
One voice, because the ledger above is not a substitute for one. Nima Dorje Tamang was at Hakubesi when the water came, ran uphill with his family, was caught, and held on to a tree by the bank until his father and brother reached him. He spoke to The Kathmandu Post from an orthopaedic ward in Kathmandu, where doctors were pressing his left foot. “Even the air makes it hurt,” he told them. Then, about home: “We lost our uncle, aunt, sister, and brother‑in‑law. And everyone says there will be a massive flood again.”
The second flood was made of pictures
Within hours, a great deal of footage that had nothing to do with Nepal was circulating as if it did, and some of it had never happened anywhere.
A ten‑second clip of a catastrophic flood posted to X on the morning of 27 August passed seven million views. Run through the AI detection tool Hive Moderation, it came back 97.2% likely to be machine‑generated; X’s community notes flagged it and BBC Verify debunked it separately. A video captioned in English “This is a GLOF” turned out, when Nepal Fact Check traced it, to be a glacial outburst at Columbia Glacier in Alaska. A clip praising Nepal’s home minister for entering a tunnel at the disaster site was a tunnel rescue in Uttarakhand, India, posted by the Uttarakhand police fire service on 14 August.
Families were searching for missing relatives in that feed, which is reason enough to be angry about it. But look again at the GLOF clip. The true story here is that there was no lake — which is precisely what made this thing impossible to warn against. The fake was conventional, so it taught its seven million viewers the wrong lesson about the real event.
If you want to look at the evidence yourself
All of this is public. None of it requires you to take a journalist’s word for anything.
- The geologist’s walkthrough. The clearest public explanation of the flow, and of what the border‑post footage actually shows, is on the YouTube channel TheGeoModels: “How did the Nepal debris flow get so big, and what’s important about the Border Port video?” (30 August; about three million views when this piece was written). The follow‑ups are worth more than the first, because they are where the doubt lives: “Are we sure about the source of the Nepal debris flow and flood? (the lake question)” (2 September) and “Nepal was a geologic event, and this house somehow survived it (how?)” (3 September).
- The border‑post footage. Two of the surveillance clips have been placed in the public domain on Wikimedia Commons: looking downstream and looking upstream. The camera clock on the still frame reads 10:59:51 — which is how GFZ, in Germany, knew the flow took under ten minutes to cover the distance. Consider yourself warned about what they show.
- The source area in three dimensions. China’s Ministry of Natural Resources imagery, with the before‑and‑after comparison, is published here.
- The satellite maps. The International Charter “Space and Major Disasters” was activated at 14:58 UTC+02:00 on 26 August, at the request of the Asian Disaster Reduction Center on behalf of Nepal’s Department of Hydrology and Meteorology. Activation 1052 carries the before‑and‑after impact maps, and links out to Sentinel Asia and a UNOSAT web map.
- The seismic records. The two USGS event pages (first, second) and GEOFON’s are open, with the raw waveforms behind them.
- Everything in one place. ICIMOD, the intergovernmental centre for this mountain range, keeps a running page collecting its researchers’ interviews and the relevant background reports.
Nepal, when you are ready to look away from it
There is a small channel called WEBCAM NEPAL LIVE that keeps cameras running at lodges and hotels across the high valleys and simply leaves them on. When this piece was written, the feed from Thame village was live, and so was the Everest panorama from Hotel Everest View at 3,880 metres. They come and go, so you may find one dark.
Watch them for a while. Nothing happens. Cloud crosses a ridge, someone walks past with a load, the light changes. This is what the overwhelming majority of days in these mountains consist of, and it is the necessary corrective to a story like this one.
Thame, as it happens, is not a neutral choice. It was hit by a glacial lake outburst flood in 2024 — the kind with a lake, the kind you can plan for — and ICIMOD published a report on its causes and future risks. It is still there. People are still living in it, and a camera on the wall of a lodge is quietly streaming it to anyone who wants to look.
For the country in its own voice, two Nepali broadcasters were added to this site’s channel list on the day this piece was published: Kantipur TV HD, the largest private network, whose programmes carried ICIMOD’s researchers explaining the flood in Nepali, and Nepal Television, which describes itself on its own site as a public service broadcasting institution reaching over 72 percent of the population. Both were streaming live when they were checked on 7 September. The bulletin running on Nepal Television at that moment was titled, in Nepali, Nepal Television news, with a Rasuwa flood update — which is the plainest answer to the question of whether this story has left the news cycle in the country it happened to.
Where money actually goes
The test applied to every organisation below was narrow and mechanical: does an appeal for this disaster appear on the organisation’s own website, and does that page open today? Several well‑known names did not pass, and are not listed. This is not financial advice and there is no arrangement of any kind between this site and any group named here.
- The IFRC emergency appeal for the Nepal Red Cross Society. The appeal is on the IFRC’s own emergency page as MDRNP022, opened on 28 August, asking for 25 million Swiss francs, with an operational strategy document dated 5 September. The donation page says in its own words: “Donations are made to the IFRC, which will channel resources to the NRCS and ensure accountability for their use.” This is the most direct earmarked route from outside the country.
- Nepal Red Cross Society directly. Its own site is publishing daily situation reports and photographs from Rasuwa and Nuwakot — a generator carried to Dhunche so that more than a hundred people could charge their phones and tell relatives they were alive; a drinking‑water service started in Bidur. Its donation portal asks you to choose a campaign, so read that dropdown before you confirm.
- Médecins Sans Frontières. Listed with the organisation’s own honesty attached. An MSF team reached Nepal within a day, but the charity states plainly: “It’s currently not clear if we’ll be responding to the flood. However, you can support us by giving an unrestricted gift.” A donation here is a donation to MSF, not to this valley. That is a perfectly good thing to do with money, as long as you know which one you are doing.
- GlobalGiving’s Nepal Flood Relief Fund. A pooled fund that names this event on its own page — “A massive flash flood surged through the Bhote Koshi river system on August 26, devastating communities in Nepal’s Rasuwa district and downstream areas” — and passes the money to organisations already working in the affected districts rather than running its own operation. Its project page lists what it has raised so far.
- The Prime Minister’s Disaster Relief Fund. The government route. Nepal’s foreign ministry has instructed its missions abroad to open accounts to collect contributions where direct payment to the fund is impractical, so from outside the country the practical path is your nearest Nepali embassy or consulate rather than a web form.
Watch it land
Every stream on this site is embedded from the broadcaster’s own official channel. For this story: Al Jazeera English, which is where ICIMOD’s director general made the “tsunami from the sky” remark; CGTN for the Chinese side and its official science releases; CNA and WION for the region; and DW News, Associated Press and Reuters for the wires. Or open the full channel list and pick your own.
Sources
- U.S. Geological Survey, “2026 Nepal Debris Avalanche and Flash Flood” (last updated 28 August 2026), and the catalogue entries for events us7000tbwb and us7000tc90 — timing, magnitudes, the “landslide” classification, travel distance, and the 2015 comparison.
- GFZ Helmholtz Centre for Geosciences, “Extreme flooding in China and Nepal” (27 August 2026, edited 28 August) — the hanging‑glacier mechanism, the 40–50 m/s velocity, the border‑post timing, the Hovius quotations, the critique of lake‑based warning, and the Cook et al. 2021 Science result; and the GEOFON event record.
- CGTN / CCTV English, “How do newly released 3D images explain the Gyirong mudslide?” (29 August 2026) — Guo Zhaocheng’s elevations and speed calculation, the upstream run, and the access problems on the Chinese side.
- Stuart Dunning, interviewed in The Conversation, “How does a collapsing glacier turn into a lethal wall of mud and water?” (27 August 2026) — the three possible sequences, “hazard cascade,” the absence of a lake, the permafrost “glue,” and the precursor question.
- Levan Tielidze and Tirthankar Ghosh, The Conversation, “The collapse of a mountainside triggered Nepal’s devastating floods” (1 September 2026) — the rock‑first hypothesis, the 1,200‑metre drop, the sixty‑avalanche analysis, and Chamoli; and Tielidze’s earlier satellite reconstruction (28 August 2026).
- Mohana Basu, Nature, “Satellite images before Nepal disaster showed warning signs” (2 September 2026) — Manoochehr Shirzaei on the Sentinel‑1 deformation signal and its limits.
- Bob Henson, Yale Climate Connections, “The worrying climate link to Nepal’s avalanche and flood catastrophe” (28 August 2026) — the USGS reclassification and Mylène Jacquemort’s emailed assessment.
- ICIMOD, “Kyirong‑Rasuwa flood 2026” — the summarised interviews with Pema Gyamtsho, Saswata Sanyal, Sarthak Shrestha and Qianggong Zhang, and the Thame 2024 report.
- The Kathmandu Post, “Flash flood hits Rasuwa, damages hydropower projects and markets” (26 August 2026) — the first-day reporting, including Narendra Pariyar’s remarks to Kantipur.
- Subeksha Poudel, The Kathmandu Post, “Nepal sent its disaster alert 38 minutes after the glacier collapse. It wasn’t enough” — the minute‑by‑minute reconstruction, Anil Pokhrel, Lok Vijay Adhikari, Shanti Mahat, and Nima Dorje Tamang.
- Daya Dudraj, The Kathmandu Post, “In disaster aftermath, Nepal battles a flood of misinformation” (31 August 2026) — the three debunked videos.
- Ministry of Foreign Affairs, Government of Nepal, “Daily Situation Update on Bhote Koshi River Floods — 06 September 2026” — all Nepal casualty and rescue figures, the road and cable‑crossing repairs, and the Prime Minister’s Disaster Relief Fund instruction.
- Xinhua, “43 dead, 519 missing after mudslide hits border port in China’s Xizang” (6 September 2026) — all figures for the Chinese side, the rescue deployment, and the data‑sharing arrangement.
- UNICEF Nepal, “More than one week on from Nepal’s floods, thousands of children remain without safe water and face rising risk of disease” (Kathmandu, 3 September 2026) — the water and sanitation figures and the Alice Akunga quotations.
- IFRC, “Nepal: Flash Floods 2026” — the emergency appeal MDRNP022, its 25 million Swiss franc target dated 28 August 2026, and the operational strategy of 5 September.
- Republica, “NDRRMA estimates loss of approximately Rs 400 billion in Bhotekoshi floods” (4 September 2026) — the 387.54 billion rupee estimate and Dharma Raj Upreti’s restoration figure; converted using Nepal Rastra Bank’s published rate for 5 September 2026.
- GFZ Helmholtz Centre for Geosciences, “Landslide triggers megatsunami in narrow fjord” (8 August 2024) — Dickson Fjord, the nine‑day signal, and the glacier‑retreat conclusion (Carrillo‑Ponce et al., The Seismic Record, 2024).
- NASA Earth Observatory, “Record‑Setting Retreat of Hektoria Glacier” (4 May 2026) — the Antarctic retreat figures and the grounded‑ice distinction (Ochwat et al., Nature Geoscience, 2025).
Every figure and quotation above was taken from the pages linked here on 7 September 2026, and each is attributed in the text to the body that issued it. Casualty and damage figures are provisional and were still being revised when this was written; the USGS marks its own findings preliminary and subject to revision. Where this piece states an opinion, it says so.